Agnico Eagle Mines Ltd
Summary
- Agnico Eagle is a global leader in the gold mining business started in 1957.
- Its operating mines are located in Canada, Finland and Mexico, with exploration and development activities in each of these countries as well as in the United States, Sweden and Colombia.
- The company own Canadian Malartic which is one of the world’s largest gold mines.
- In 2020, the company gold production totaled 1,736,568 ounces of gold.

Overview
Agnico Eagle (NYSE:AEM) (TSX:AEM) is a senior Canadian gold mining company that has produced precious metals since 1957. Its operating mines are located in Canada, Finland and Mexico, with exploration activities in each of these countries as well as in the United States and Colombia. The Company and its shareholders have full exposure to gold prices due to its long-standing policy of no forward gold sales. Agnico Eagle has declared a cash dividend every year since 1983. 1
Business Overview
The Company is a senior Canadian gold mining company that has produced precious metals since 1957. Its operating mines are located in Canada, Finland and Mexico, with exploration and development activities in each of these countries as well as in the United States, Sweden and Colombia.
Exploration Sites
- Anza
- Delta
- Douay/Joutel
- Dubuisson
- El Barqueño
- Ellison
- Gryphon Gold
- Hammond Reef
- Hanhimaa
- Jennings
- Kirkland Lake
- Kuotko
- Morelos Sur
- Pandora / Wood-Pandora
- Pitaya
- Santa Gertrudis
Operations
In 2020, payable gold production totaled 1,736,568 ounces of gold (including 36,416 ounces of pre-commercial gold production from the IVR pit at Amaruq, the Tiriganiaq open pit at Meliadine, and the Barnat pit at Canadian Malartic), with production costs per ounce of $838, total cash costs per ounce of $775 and all-in sustaining costs (AISC) per ounce of $1,051. Production costs, total cash costs per ounce and AISC per ounce exclude the pre-commercial production ounces from IVR, Tiriganiaq and Barnat.2
The 2.6% decrease in gold production in 2020 compared to 2019 was primarily due to the temporary shutdowns or reduced activity levels as a result of measures taken by the Quebec and Mexican governments related to the COVID-19 pandemic.
In 2021, payable gold production is expected to be approximately 2.05 million ounces (mid-point), while total cash costs per ounce are expected to be between $700 to $750, and AISC are forecast between $950 to $1,000 per ounce of gold, on a by-product basis. This guidance for 2021 does not include production from the newly acquired Hope Bay gold project in Nunavut.
| Operations | Mine/Project Type | Estimated Mine Life | 2020 Production | 2020 Total Cash Costs |
| Canadian Malartic | Open Pit Mine | 2011-2028 (O/P only) | Agnico Eagle's 50% share of Production - 284,317 oz gold; 347,598 oz silver | $723/oz gold |
| Goldex | Underground Mine | 2013-2030 | 127,540 oz gold | $634/oz gold |
| Kittila | Underground Mine | 2009-2034 | 208,125 oz gold | $805/oz gold |
| La India | Open Pit Mine | 2014-2023 | 84,974 oz gold; 65,124 oz silver | $788/oz gold |
| LaRonde Complex | Underground Mine | 1988-2030 | 349,913 oz gold; 684,099 oz silver; 6,259 tonnes zinc; 3,069 tonnes copper | $517/oz gold |
| Meadowbank Complex | Open Pit Mine | Meadowbank 2010-2019; Amaruq satellite deposit 2019-2026 | 209,413 oz gold; 62,679 oz silver | $1,404/oz gold |
| Meliadine | Underground Mine/Open Pit Mine | 2019-2032 | 318,889 oz gold; 27,016 oz silver | $774/oz gold |
| Pinos Altos | Open Pit/Underground Mine | Pinos Altos 2009-2026; Creston Mascota 2011-2020 | 153,397 oz gold; 2.2 million oz silver | Pinos Altos $749/oz gold; Creston Mascota $605/oz gold |
| Hope Bay | Underground Mine | 2017- |
Canadian Malartic
Canadian Malartic is one of the world’s largest gold mines. The 55,000+ tonnes/day open-pit mine and plant produced 568,634 ounces of gold in 2020 (100% basis, and including pre-commercial production from the Barnat pit). Open pit mine life is expected to last through 2028, and does not include development of the underground Odyssey Project. Proven and probable mineral reserves total 2.21 million ounces of gold (61 million tonnes at 1.12 grams/tonne gold) on a 50% basis, as of December 31, 2020.
Goldex
Goldex, located 60 km east of the Company's LaRonde mine, has proven and probable mineral reserves of 1.1 million ounces of gold (22.1 million tonnes grading 1.57 grams/tonne gold) as of December 31, 2020. The mine currently exploits the M and E Zones as well as the Dx and Deep 1 zones. The South Zone is under development, and the Deep 2 Zone is being explored from an underground ramp. Internal studies are ongoing to evaluate the potential to increase throughput from the Deep 1 and South Zones and the potential to accelerate mining activities on a portion of the Deep 2 Zone (which starts below the Deep 1 Zone at 1,200 m below surface), all of which could enhance production levels or extend the current mine life at Goldex and reduce operating costs.
Hope Bay
On February 2, 2021, Agnico Eagle acquired TMAC Resources Inc., the operator of the Hope Bay property located in the Kitikmeot region of Nunavut, Canada. The property and operations are remote but not isolated, serviced by both a port and airstrip. Hope Bay is an 80 km by 20 km Archean greenstone belt that has been explored by multiple companies over a period spanning more than 30 years. TMAC began producing gold in early 2017 from Doris, its first mine at Hope Bay, and processed gold at the Doris processing plant which originally had nameplate capacity of 1,000 tpd and expanded to 2,000 tpd midway through 2018.
The Company expects to spend $16.2 million in 2021 for 69,600 metres of drilling at the Hope Bay property, including $5.5 million for 29,800 metres of delineation drilling to support production at the Doris mine and $10.7 million for 39,800 metres of drilling on exploration targets around the Doris, Madrid and Boston deposits and other targets along the belt. The Company is currently evaluating exploration priorities and metres allocated on each program and may adjust the allocation during the course of 2021.
Kittila
The Kittila mine is located in the Lapland region of northern Finland, approximately 900 km north of Helsinki and 150 km north of the Arctic Circle. The climate is moderated by the Gulf Stream off the coast of Norway, such that northern Finland’s climate is comparable to that of eastern Canada and mining work can be carried out year-round. With a mine life estimated through 2034, Kittila is its longest-life mine; its proven and probable mineral reserves contain 4.1 million ounces of gold (30 million tonnes grading 4.16 g/t gold) as of December 31, 2020.
The Kittila property covers 192 square km, stretching 25 km along the Suurikuusikko Trend, a major gold-bearing shear zone. The mine area includes a group of six gold deposits along a 4.5-km segment of the trend. The largest of the deposits is the Main Zone in the Suuri, Roura and Rimpi areas that contain most of the current mineral reserves and mineral resources at Kittila. The other deposits are the undeveloped Sisar Zone, which is sub-parallel to the Main Zone, as well the Etela and Ketola zones.
La India
The La India mine hosts proven and probable mineral reserves of 0.3 million ounces of gold and 1.2 million ounces of silver (12 million tonnes grading 0.66 g/t gold and 3.00 g/t silver) as of December 31, 2020.
The above total includes the Chipriona open pit, polymetallic deposit, which has indicated mineral resources of 44,000 ounces of gold, 2.0 million ounces of silver and 16,600 tonnes of zinc (1.3 million tonnes grading 1.08 g/t gold, 49.81 g/t silver and 1.31% zinc) and inferred mineral resources of 278,000 ounces of gold, 31.1 million ounces of silver and 103,900 tonnes of zinc (12.8 million tonnes grading 0.68 g/t gold, 75.59 g/t silver and 0.81% zinc) as of December 31, 2020.
LaRonde Complex
Forming part of the LaRonde Complex, the 7,000-tonnes/day LaRonde mine and processing facility has produced over 6 million ounces of gold as well as valuable by-products. The LaRonde mine still has 3.0 million ounces of gold in proven and probable mineral reserves (15.2 million tonnes grading 6.12 grams of gold per tonne) as of December 31, 2020.
LZ5 has proven and probable mineral reserves of 788,000 ounces of gold (11.8 million tonnes grading 2.08 grams per tonne gold) as of December 31, 2020. Mineral reserves and mineral resources from the adjacent, 100%-owned Ellison property were included in LZ5 mineral resources and mineral reserves beginning in 2020. The LZ5 mine is expected to maintain a production rate of approximately 3,000 tpd through 2029.
Meadowbank Complex
The Meadowbank Complex refers to the processing facilities and infrastructure at the Meadowbank mine site combined with the mining and infrastructure at the Amaruq site. The 118,862-hectare Amaruq property is located approximately 50 km northwest of the Meadowbank mine site, with a 64-kilometre road between the two sites completed in August 2017 and widened for ore haulage in November 2018.
Discovered in 2013, Amaruq hosts the Whale Tail gold deposit as well as the V Zone (IVR Zone), Mammoth Zone and several other targets. At December 31, 2020, the Amaruq property was estimated to contain open pit proven and probable mineral reserves of 2.3 million ounces of gold (19.9 million tonnes grading 3.64 g/t), underground probable mineral reserves of 564,000 ounces of gold (3.3 million tonnes grading 5.29 g/t), as well as substantial open pit and underground indicated and inferred mineral resources.
Meliadine
The Meliadine mine is located near the western shore of Hudson Bay in the Kivalliq District of Nunavut, about 25 km north of Rankin Inlet and 290 km southeast of its Meadowbank mine. Meliadine includes seven gold deposits, six of which are part of the current mine plan. The 98,222-hectare property covers an 80-km-long greenstone belt.
Commercial production began at Meliadine on May 14, 2019. The Company anticipates that mining at Meliadine will be carried out through several underground mining operations and open pits over a mine life extending to 2032. There are numerous opportunities to create additional value at Meliadine, both at the mine and on the large regional land package.
Pinos Altos
Pinos Altos is estimated to contain proven and probable mineral reserves of 878,000 ounces of gold and 19.9 million ounces of silver (13.5 million tonnes grading 2.03 g/t gold and 45.94 g/t silver) as of December 31, 2020. The mine transitioned into an underground mining operation in 2018 and 2019, with associated higher costs.
In 2020, the Company started underground and open pit production at Sinter and depleted the Bravo Pit at Creston Mascota approximately mid-year, with residual gold leaching continuing through 2020 and into the first quarter of 2021. The Creston Mascota deposit has now been depleted and the operation has reached the end of its mine life.
Financial Overview
Agnico Eagle reported net income of $511.6 million, or $2.12 per share, in 2020 compared with net income of $473.2 million, or $2.00 per share, in 2019. In 2018, the Company reported net loss of $326.7 million, or $1.40 per share. Agnico Eagle reported adjusted net income of $451.6 million, or $1.87 per share, in 2020 compared with adjusted net income of $229.4 million, or $0.97 per share, in 2019. In 2018, the Company reported adjusted net income of $71.9 million, or $0.31 per share. In 2020, operating margin increased to $1,714.0 million from $1,247.2 million in 2019. In 2018, operating margin was $1,030.9 million. 3
Revenues from Mining Operations
Revenues from mining operations increased by $643.2 million, or 25.8%, to $3,138.1 million in 2020 from $2,494.9 million in 2019 primarily due to a 27.2% increase in the average realized price of gold between periods. Revenues from mining operations were $2,191.2 million in 2018.
Revenues from the Northern Business increased by $615.8 million, or 30.0%, to $2,668.8 million in 2020 from $2,053.0 million in 2019 primarily due to a higher average realized price of gold. Revenues from the Southern Business increased by $27.4 million, or 6.2%, to $469.3 million in 2020 from $441.9 million in 2019, primarily due to a higher average realized price of gold. Revenues from the Northern Business were $1,739.2 million and revenues from the Southern Business were $452.0 million in 2018.
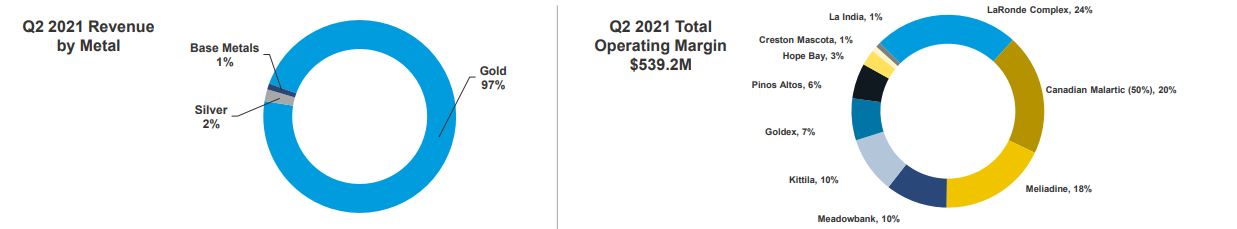
Sales of precious metals (gold and silver) accounted for 99.5% of revenues from mining operations in 2020, an increase from 98.9% in 2019 and 98.4% in 2018. The increase in the percentage of revenues from precious metals in 2020 compared with 2019 was primarily due to a higher average realized price of gold.
Revenues from gold increased by $653.5 million or 27.3% in 2020 compared with 2019 primarily due to an 27.2% increase in the average realized price of gold. The Company’s average realized price of gold increased to $1,788 in 2020 compared to $1,406 in 2019, and the sales volume of gold increased to 1,693,029![]() ounces in 2020 compared to 1,691,300
ounces in 2020 compared to 1,691,300![]() ounces in 2019.
ounces in 2019.
Revenues from silver increased by $0.7 million or 1.0% in 2020 compared with 2019 primarily due to a 24.8% increase in the average realized price of silver to $20.44 in 2020 from $16.38 in 2019. Revenues from zinc decreased by $12.7 million or 86.6% to $2.0 million in 2020 compared with $14.7 million in 2019 primarily due to a 59.2% decrease in the sales volume of zinc between periods. Revenues from copper increased by $1.8 million or 13.6% in 2020 compared with $13.0 million in 2019 primarily due to a 6.9% increase in the average realized price of copper, partially offset by a 9.7% decrease in the sales volume of copper between periods.
Costs
Production costs increased to $1,424.2 million in 2020 compared with $1,247.7 million in 2019 primarily due to the contribution of mining and milling costs from the Meliadine mine, which achieved commercial production during the second quarter of 2019, and higher open pit mining costs at the Meadowbank Complex which resulted from the transition of mining operations to the Amaruq satellite deposit. Partially offsetting the overall increase was a decrease in the mining costs at the LaRonde Complex as a result of the Company’s automation strategy, which improved productivity. Production costs were $1,160.4 million in 2018.
Exploration and corporate development expense increased by 8.3% to $113.5 million in 2020 from $104.8 million in 2019. Exploration and corporate development expense was $137.7 million in 2018.
Finance costs decreased to $95.1 million in 2020 compared with $105.1 million in 2019 and $96.6 million in 2018 primarily due to decreased interest expense on the Company’s guaranteed senior unsecured notes (the ‘‘Notes’’) as $360.0 million of the 2010 Series B Notes were repaid in April 2020, partially offset by increased interest expense relating to the $200.0 million private placement of guaranteed senior unsecured notes which were issued in April 2020. The aggregate outstanding principal of the Notes was $1,575.0 million at December 31, 2020 and $1,735.0 million at December 31, 2019.
In 2020, the Company recorded income and mining taxes expense of $256.0 million on income before income and mining taxes of $767.6 million at an effective tax rate of 33.3%. In 2019, the Company recorded income and mining taxes expense of $265.6 million on income before income and mining taxes of $738.7 million at an effective tax rate of 36.0%. The Company’s 2020 and 2019 effective tax rate is higher than the applicable statutory tax rate of 26.0% due to the impact of mining taxes. In 2018, the Company recorded income and mining taxes expense of $67.6 million on a loss before income and mining taxes of $259.1 million at an effective tax rate of (26.1)%.
2021 and 2022 Outlook
The mid-point of payable gold production guidance for 2021 and 2022 is 2.05 and 2.1 million ounces, respectively, which is unchanged from the outlook provided on February 13, 2020. At this time, gold production guidance excludes production from the newly acquired Hope Bay deposits.
Second Quarter 2021 Results
July 28, 2021; Agnico Eagle Mines Limited reported quarterly net income of $189.6 million, or net income of $0.78 per share, for the second quarter of 2021. This result includes non-cash mark-to-market gains on warrants of $15.9 million ($0.07 per share), foreign currency translation gains on deferred tax liabilities of $9.3 million ($0.04 per share), derivative gains on financial instruments of $1.8 million ($0.01 per share), non-cash foreign currency translation losses of $2.4 million ($0.01 per share) and various other adjustment losses of $2.7 million ($0.02 per share). Excluding these items would result in adjusted net income1of $167.7 million or $0.69 per share for the second quarter of 2021. For the second quarter of 2020, the Company reported net income of $105.3 million or net income of $0.44 per share.4
Included in the second quarter of 2021 net income, and not adjusted above, are non-cash stock option expense of $3.9 million ($0.02 per share) and workforce costs of employees affected by the COVID-19 pandemic (primarily Nunavut-based) of $2.5 million ($0.01 per share).
In the first six months of 2021, the Company reported net income of $325.7 million, or net income of $1.34 per share. This compares with the first six months of 2020, when net income was $83.7 million, or net income of $0.35 per share.
In the second quarter of 2021, the Company's payable gold production was 500,698 ounces (excluding 25,308 ounces of payable gold production at Hope Bay, and including 9,053 ounces and 348 ounces of pre-commercial production of gold at the Tiriganiaq open pit at Meliadine and Amaruq underground project, respectively). This compares to quarterly payable gold production of 331,064 ounces in the prior-year period (which included 2,651 ounces of pre-commercial production of gold at the Barnat deposit at Canadian Malartic). Including the Hope Bay mine, the Company's quarterly gold production was 526,006 ounces in the second quarter of 2021.
Production costs per ounce in the second quarter of 2021 were $834 (excluding the Hope Bay mine), compared to $854 in the prior-year period. Total cash costs per ounce in the second quarter of 2021 were $739 (excluding the Hope Bay mine), compared to $825 in the prior-year period. Including the Hope Bay mine, production costs per ounce were $827 and total cash costs per ounce were $748 in the second quarter of 2021.
Total capital expenditures (including sustaining capital) in the second quarter of 2021 were $209.3 million (excluding Hope Bay), lower than forecast primarily due to the timing of expenditures. Including Hope Bay, the total capital expenditures in the second quarter of 2021 were $220.3 million. Capital spending is expected to return to more normalized levels over the balance of the year and the total capital expenditures (including sustaining capital) in 2021 remain forecast to be approximately $803.0 million, excluding the Hope Bay mine. Pre-commercial production at the Tiriganiaq open pit at Meliadine is incorporated in, and netted against, the total 2021 capital expenditure forecast. As a result, some variability is likely depending on the timing of the achievement of commercial production, prevailing gold prices and foreign exchange rates.
2021 Production and Cost Guidance Unchanged
Production guidance for 2021 remains unchanged at approximately 2,047,500 ounces of gold (including approximately 30,000 ounces and 350 ounces of pre-commercial gold production from the Tiriganiaq open pit at Meliadine and Amaruq underground project, respectively). The Company anticipates that total cash costs per ounce and AISC per ounce for 2021 will continue to be in the range of $700 to $750 and $950 to $1,000, respectively. Estimated payable gold production and costs for 2021 exclude any contribution from Hope Bay.
Quarterly production guidance for Hope Bay is unchanged at approximately 18,000 to 20,000 ounces of gold at total cash costs per ounce of $950 to $975 and AISC per ounce of $1,525 to $1,575.


